
A beginner-friendly guide to understanding crypto charts, technical analysis, and candlestick patterns for smarter trading decisions
If you’ve ever stared at a crypto chart and felt like you were trying to decode an alien language, you’re not alone. Those bars, lines, and candlesticks can seem intimidating at first—but they’re not as complex as they appear.
Think of crypto charts as your map to the treasure. With a basic understanding of how to interpret them, you can spot trends, anticipate price movements, and avoid expensive mistakes. This is especially important for anyone considering a Crypto Long Term Investment. Making decisions based purely on emotion, without understanding the data, is one of the fastest ways to lose money in the volatile world of cryptocurrency.
The better news? You don’t need a finance degree to understand crypto charts. You just need an easy-to-follow, step-by-step guide with no room for interpretation. And that is exactly what this article will provide.
By the time you are done reading, you will:
✔️ Understand what crypto charts are and why they matter
✔️ Learn how to spot trends and patterns
✔️ Use key indicators to make smarter trading decisions
✔️ Avoid common beginner mistakes that can drain your wallet
Ready to take the guesswork out of crypto trading? Let’s dive in.
What Are Crypto Charts?
Imagine you are trying to predict the weather. You would not just walk outside, look at the sky, and assume it will be sunny forever, right? You would check weather reports, past trends, and temperature charts.
Crypto charts work the same way. They help traders analyze past price movements to make educated guesses about the future.
At its core, a crypto chart is just a visual representation of price changes over time. It shows you:
✅ How much a cryptocurrency is worth at any given moment
✅ How its price has changed over minutes, hours, days, or even years
✅ Trends and patterns that can help predict where it is heading next
Why Are Crypto Charts Important?
If you are serious about trading, you cannot just rely on news headlines, Twitter hype, or gut feelings. The market moves fast, and prices can swing wildly within minutes. Crypto charts help you:
Spot Trends: Is the price generally moving up or down?
Find Entry & Exit Points: When is a good time to buy or sell?
Avoid Emotional Trading: Make decisions based on facts, not panic or FOMO.
Think of it this way—would you drive a car with your eyes closed? Of course not! Reading crypto charts gives you the visibility you need to navigate the market safely.
How Do Crypto Charts Work?
A crypto chart is made up of three main things:
Timeframe – You can set charts to display price data for different periods (minutes, hours, days, etc.). Short-term traders use smaller timeframes, while long-term investors prefer daily or weekly charts.
Price Movement – The chart shows how prices change over time. You will see prices go up, down, or stay relatively stable.
Trading Volume – This tells you how many people are buying and selling at a given time. A high volume means strong interest, while low volume suggests weak momentum.
Live Crypto Charts vs. Historical Charts
There are two main ways to look at crypto charts:
Live Crypto Charts – These update in real-time, showing the latest price movements. They are useful for day traders who need to make fast decisions.
Historical Charts – These show past price movements over longer periods. They help traders identify trends and make long-term predictions.
Crypto charts might look intimidating at first, but once you break them down, they are actually pretty simple. They tell you:
✔️ Where the price has been
✔️ Where it is now
✔️ Where it might go next
Understanding this is the first step to becoming a smarter crypto trader. Now, let us move on to the different types of charts and how to read them like a pro!
Understanding Crypto Chart Basics
Alright, now that you know what crypto charts are and why they matter, let us break them down further. If you have ever stared at a crypto chart and thought, “What am I even looking at?”—this section is for you.
A crypto chart has three main elements:
1 Price movement – How the price of a cryptocurrency changes over time.
2 Timeframes – The period the chart covers (minutes, hours, days, etc.).
3 Trading volume – How many people are buying and selling at a given time.
Let us tackle each one.
1. Price Movement: The Heartbeat of Crypto Trading
Price movement is what traders care about the most. Every second, prices shift based on supply, demand, and market sentiment.
Crypto charts use different visual styles to show price movement. Some of the most common are:
Line Charts – The simplest way to track prices over time.
Bar Charts – Show price changes with vertical bars.
Candlestick Charts – The most detailed and widely used chart type.
We will get into these chart types in the next section, but for now, just remember that all charts are just different ways to show price movement.
2. Timeframes: Choosing the Right View
Crypto charts can display price changes over different timeframes, which affects how the chart looks.
Short-Term Timeframes (1 min, 5 min, 15 min, 1 hour)
- Used by day traders who buy and sell quickly.
- Show small price fluctuations in real time.
- Can be noisy and unpredictable due to rapid market swings.
Medium-Term Timeframes (4 hours, 1 day, 1 week)
- Good for swing traders who hold for days or weeks.
- Help spot larger trends and potential breakout points.
Long-Term Timeframes (1 month, 3 months, 1 year+)
- Preferred by long-term investors and HODLers.
- Show broader trends over months or years.
- Ignore short-term volatility and focus on big-picture growth.
Choosing the right timeframe depends on your trading style.
- Day traders? Use smaller timeframes.
- Swing traders? Medium time frames work best.
- Long-term investors? Focus on daily or weekly charts.
3. Trading Volume: The Market’s Pulse
Volume tells you how much of a cryptocurrency is being traded. It is one of the most important indicators in technical analysis.
High Volume = Strong Interest – If a coin is being bought or sold in large amounts, it means many traders are paying attention. This can confirm a price trend.
Low Volume = Weak Momentum – If a coin has low trading volume, it means fewer people are buying or selling it. Price moves during low
-volume periods can be misleading.
For example:
– If Bitcoin’s price jumps with high volume, it suggests real buying pressure and a strong trend.
– If Bitcoin’s price jumps with low volume, it might just be a temporary spike with no real momentum.
Before you start trading, you need to understand:
✔️ How price moves over time
✔️ Which timeframe suits your strategy
✔️ Why trading volume matters
Now that you have these fundamentals down, it is time to dive into the different types of crypto charts—and which one is best for you!
Types of Crypto Charts
Crypto charts come in different styles, each giving traders a unique way to analyze price movements. Some charts are simple, while others provide deeper insights into market trends. Choosing the right type of chart depends on how much detail you need.
Here are the three most common crypto charts:
| Chart Type | Best For | Pros | Cons |
| Line Chart | Beginners, long-term trends | Easy to read, good for big-picture views | Lacks details on price fluctuations |
| Bar Chart | Traders analyzing price ranges | Shows opening, closing, high, and low prices | Harder to read for beginners |
| Candlestick Chart | Most traders, detailed analysis | Shows market trends, clear visual patterns | Can be overwhelming at first |
Line Chart
A line chart is the simplest type of crypto chart. It connects closing prices over a selected time period with a line.
- Best for long-term investors who want a quick overview of price trends.
- Easy to read but does not show price fluctuations within each time period.
Example: If Bitcoin starts the day at $40,000, drops to $38,500, then closes at $39,500, the line chart will only plot the closing price of $39,500.
Bar Chart
A bar chart provides more detail than a line chart. Each bar represents a period of time (such as an hour, a day, or a week) and shows:
- Opening price (left notch)
- Closing price (right notch)
- Highest price reached (top of the bar)
- Lowest price reached (bottom of the bar)
Bar charts help traders see price ranges and market volatility. However, they can be tricky to read for beginners.
Candlestick Chart
Candlestick charts are the most widely used in crypto trading. They provide the same information as bar charts but in a more visual format.
Each candlestick has:
- A body (represents the opening and closing price)
- A wick (shadow) (shows the highest and lowest prices)
- A color (green for price increases, red for price decreases)
Candlestick charts help traders spot patterns that suggest whether prices will rise or fall. Because they provide so much detail, they are the preferred choice for technical analysis.
Next, we will break down how to read candlestick patterns and what they tell you about market trends.
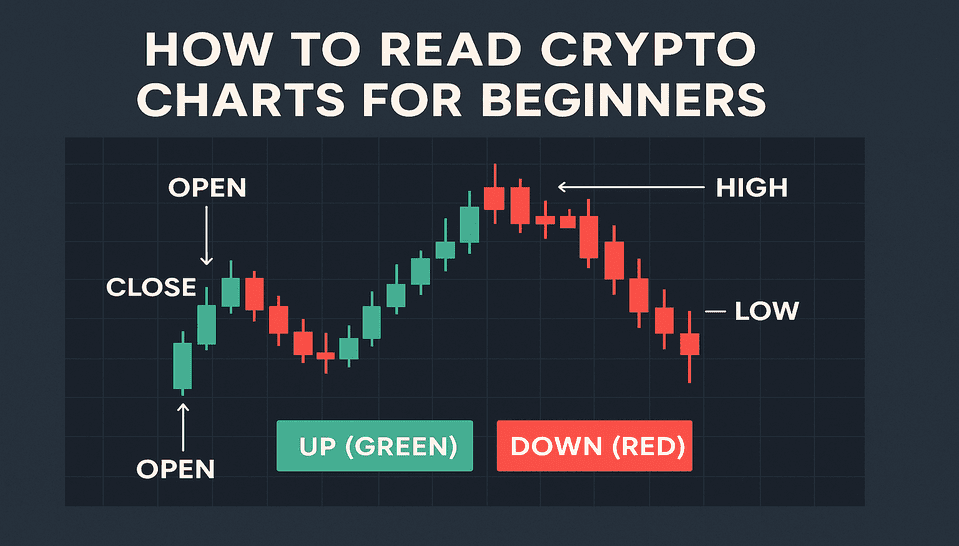
How to Read Candlestick Patterns

Image credit: Good Crypto
Candlestick charts are the most popular among crypto traders because they give detailed insights into price movement. Each candlestick represents a specific time period and shows four key price points:
- Open Price – The price at which the asset started during the time period.
- Close Price – The price at which the asset ended during the time period.
- High Price – The highest price reached during that period.
- Low Price – The lowest price reached during that period.
Each candlestick has a body and wicks (shadows):
- The body represents the difference between the opening and closing price.
- The wicks (thin lines above and below) show the highest and lowest prices reached.
| Candlestick Component | Meaning |
| Green (or White) Body | Price closed higher than it opened (bullish) |
| Red (or Black) Body | Price closed lower than it opened (bearish) |
| Long Wick on Top | Buyers pushed the price up, but sellers forced it back down |
| Long Wick on Bottom | Sellers pushed the price down, but buyers pulled it back up |
Basic Candlestick Patterns
Some candlestick formations indicate potential price movements. Here are a few patterns every beginner should know:
1. Doji
- A small or nonexistent body with long wicks on both sides.
- Indicates market indecision—buyers and sellers are evenly matched.
- Often appears before a trend reversal.
2. Hammer & Inverted Hammer
- Hammer: Small body with a long lower wick. Appears after a downtrend and signals a possible reversal.
- Inverted Hammer: Small body with a long upper wick. Can indicate a trend reversal to the upside.
3. Engulfing Pattern
- A large candle completely engulfs the previous candle.
- Bullish Engulfing: A strong green candle fully covers the previous red candle, signaling a potential upward move.
- Bearish Engulfing: A strong red candle fully covers the previous green candle, signaling a potential downward move.
4. Morning Star & Evening Star
- Morning Star: A three-candle pattern that suggests a trend reversal from bearish to bullish.
- Evening Star: The opposite, signaling a reversal from bullish to bearish.
Why Candlestick Patterns Matter
These patterns help traders predict whether prices will continue in the same direction or reverse. However, no pattern is foolproof—successful traders use multiple indicators alongside candlestick patterns to confirm signals.
Next, we will learn how to read a line chart.
How to Read a Line Chart

Image Credit: Shrimpy Academy
A line chart is the most straightforward type of crypto chart. It connects closing prices over a specific period, forming a continuous line that shows the general direction of an asset’s price. While it lacks the detail of candlestick or bar charts, it is useful for spotting long-term trends.
Understanding the Line Chart Structure
A line chart consists of:
- X-axis (Horizontal) – Represents time (minutes, hours, days, weeks, or months).
- Y-axis (Vertical) – Represents price.
- A Single Line – Plots closing prices over time, smoothing out fluctuations.
| Feature | Purpose |
| Closing Price Points | Shows the last price for each time period |
| Trend Direction | Helps identify upward or downward trends |
| Simplified View | Removes market noise and focuses on overall movement |
How to Interpret a Line Chart
- Identify the Overall Trend
- Uptrend: The line moves upward over time, indicating increasing prices.
- Downtrend: The line moves downward, showing decreasing prices.
- Sideways Trend: The line remains relatively flat, indicating price consolidation.
- Uptrend: The line moves upward over time, indicating increasing prices.
- Check for Key Support and Resistance Levels
- Support Level: A price point where an asset historically stops falling and starts rising.
- Resistance Level: A price point where an asset repeatedly struggles to move higher.
- These levels help traders decide when to buy or sell.
- Support Level: A price point where an asset historically stops falling and starts rising.
- Compare Different Timeframes
- A short-term line chart (e.g., 1-hour or 1-day) shows recent price movements.
- A long-term chart (e.g., 1-month or 1-year) helps investors see overall trends.
- A short-term line chart (e.g., 1-hour or 1-day) shows recent price movements.
When to Use a Line Chart
| Best For | Why? |
| Long-term investors | Focuses on major price trends instead of daily fluctuations |
| Beginners | Simple and easy to understand |
| Identifying trends | Removes distractions from short-term market noise |
Limitations of Line Charts
- Does not show opening, high, or low prices—only the closing price.
- Lacks details on volatility and price fluctuations within a time period.
- Less useful for short-term traders who need detailed price action data.
Line charts are ideal for beginners and long-term investors but may not be enough for active traders. For a deeper analysis, many traders prefer candlestick charts or bar charts, which we have already covered.
How to Read a Bar Chart

A bar chart provides more detailed price information than a line chart but is simpler than a candlestick chart. It is commonly used in technical analysis because it shows the opening, closing, highest, and lowest prices for a given time period.
Structure of a Bar Chart
Each bar represents a specific time period (e.g., 1 minute, 1 hour, 1 day) and consists of:
| Bar Component | Meaning |
| Top of the bar | The highest price reached during the period |
| Bottom of the bar | The lowest price reached during the period |
| Left notch | The opening price |
| Right notch | The closing price |
How to Interpret a Bar Chart
- Identify the trend
- If bars are getting taller, the market is becoming more volatile.
- If bars are consistently rising, it signals an uptrend.
- If bars are consistently falling, it signals a downtrend.
- If bars are getting taller, the market is becoming more volatile.
- Look at bar colors
- Some platforms color bars green (or blue) when prices close higher than they open (bullish).
- Bars are red when prices close lower than they open (bearish).
- Some platforms color bars green (or blue) when prices close higher than they open (bullish).
- Analyze price movements
- Long bars indicate strong price movements, meaning high volatility.
- Short bars suggest low volatility, meaning price is moving within a small range.
- Bars with a long upper wick mean buyers pushed the price up, but sellers took control.
- Bars with a long lower wick mean sellers pushed the price down, but buyers regained control.
- Long bars indicate strong price movements, meaning high volatility.
When to Use a Bar Chart
| Best For | Why? |
| Traders who need more detail than line charts | Shows open, close, high, and low prices |
| Analyzing price ranges | Helps traders spot volatility and price swings |
| Identifying trend strength | Longer bars indicate stronger trends |
Limitations of Bar Charts
- Harder to read than line charts, especially for beginners.
- Less visually intuitive than candlestick charts.
- Does not highlight bullish and bearish patterns as clearly as candlesticks.
Bar charts are great for traders who want a detailed but less complex view of price action. However, most traders eventually move to candlestick charts for deeper analysis.
Next, we will explore technical analysis and how traders use different tools to predict price movements.
Technical Analysis (TA): Predicting Crypto Price Movements
Technical Analysis (TA) is the art of predicting price movements using historical data, chart patterns, and mathematical indicators. Unlike fundamental analysis, which looks at a project’s long-term value, TA focuses purely on price action and market behavior.
Traders use TA to identify trends, time their trades, and reduce risk. While no method is 100% accurate, understanding key indicators can improve decision-making.
How Technical Analysis Works
TA is based on three core principles:
- Price reflects everything – All known information (news, events, market trends) is already factored into the price.
- Prices move in trends – Markets do not move randomly; they follow patterns that traders can recognize.
- History repeats itself – Traders react to market conditions in similar ways over time, creating repeatable patterns.
Key Elements of Technical Analysis
| TA Concept | Purpose |
| Support & Resistance | Identify price levels where the market tends to reverse |
| Trend Lines | Show whether prices are moving up, down, or sideways |
| Chart Patterns | Help predict potential breakouts or reversals |
| Technical Indicators | Mathematical formulas that signal potential market movements |
Let us break these down in detail.
1. Support and Resistance
- Support is a price level where buying pressure is strong enough to prevent further declines.
- Resistance is a level where selling pressure stops prices from rising further.
| Level | Meaning | Trading Strategy |
| Support | A floor where price tends to bounce back up | Buy near support, as price may rise |
| Resistance | A ceiling where price struggles to break through | Sell near resistance, as price may drop |
If the price breaks through resistance, it often turns into new support, signaling further gains. If the price falls below support, it may keep dropping.
2. Trend Lines: Identifying Market Direction
A trend line connects price points to show the overall direction of the market.
- Uptrend – Higher highs and higher lows (bullish market).
- Downtrend – Lower highs and lower lows (bearish market).
- Sideways Trend – No clear direction, price moves in a range.
Traders follow trends instead of trading against them. “The trend is your friend” is a common saying in TA.
3. Chart Patterns: Predicting Price Movements
Patterns form on charts that help traders anticipate price moves. Some common ones include:
| Pattern | Type | What It Means |
| Head and Shoulders | Bearish | Signals a potential trend reversal downward |
| Double Top | Bearish | Price hits resistance twice before falling |
| Double Bottom | Bullish | Price hits support twice before rising |
| Triangles | Bullish/Bearish | Price is consolidating and may break out soon |
Recognizing these patterns can help traders enter or exit positions before big price moves happen.
4. Technical Indicators: Tools to Confirm Trends
Indicators help traders confirm trends, detect reversals, and spot buying/selling opportunities.
| Indicator | Purpose | How Traders Use It |
| Moving Averages (MA) | Smooths price data to reveal trends | Buy when price crosses above MA, sell when below |
| Relative Strength Index (RSI) | Measures if an asset is overbought or oversold | RSI > 70 = Overbought (sell), RSI < 30 = Oversold (buy) |
| MACD (Moving Average Convergence Divergence) | Tracks momentum and trend changes | Buy when MACD crosses above the signal line |
| Bollinger Bands | Shows volatility and price extremes | Buy near lower band, sell near upper band |
Indicators should never be used alone. Successful traders combine multiple indicators with chart patterns to make better decisions.
How Traders Use Technical Analysis
- Identify the trend (up, down, or sideways).
- Look for support and resistance levels.
- Use chart patterns to anticipate breakouts or reversals.
- Confirm signals with technical indicators.
- Set stop-loss orders to manage risk.
TA does not guarantee success, but it helps traders increase their odds of making profitable trades.
Key Indicators for Crypto Trading
Technical indicators help traders analyze price movements, identify trends, and make better trading decisions. These indicators are mathematical calculations based on historical price and volume data. While no single indicator is perfect, combining multiple indicators increases accuracy.
Types of Indicators
Crypto traders use different types of indicators for various purposes:
| Indicator Type | Purpose | Example Indicators |
| Trend Indicators | Identify market direction | Moving Averages, MACD |
| Momentum Indicators | Measure strength of price movements | RSI, Stochastic Oscillator |
| Volatility Indicators | Show market fluctuations | Bollinger Bands, ATR |
| Volume Indicators | Confirm price trends with trading volume | OBV, Volume Profile |
1. Moving Averages (MA) – Identifying Trends
Moving Averages smooth out price data to reveal overall trends.
- Simple Moving Average (SMA): Calculates the average price over a set period (e.g., 50-day SMA).
- Exponential Moving Average (EMA): Puts more weight on recent prices, making it react faster to price changes.
How to use:
- If the price is above the moving average → Uptrend (bullish signal).
- If the price is below the moving average → Downtrend (bearish signal).
- Golden Cross: Short-term MA (e.g., 50-day) crosses above long-term MA (e.g., 200-day) → Strong bullish signal.
- Death Cross: Short-term MA crosses below long-term MA → Bearish signal.
2. Relative Strength Index (RSI) – Overbought or Oversold?
RSI measures the strength of recent price movements on a scale of 0 to 100.
- Above 70 → Overbought (Price may drop soon).
- Below 30 → Oversold (Price may bounce back).
- If RSI stays above 50, it signals an uptrend; if it stays below 50, it signals a downtrend.
RSI helps traders avoid buying at peaks and selling at lows.
3. MACD (Moving Average Convergence Divergence) – Momentum & Trend Reversals
MACD helps traders spot changes in trend momentum. It consists of:
- MACD Line (difference between two EMAs).
- Signal Line (SMA of the MACD line).
- Histogram (shows strength of momentum).
How to use:
- MACD crosses above Signal Line → Bullish signal (Buy).
- MACD crosses below Signal Line → Bearish signal (Sell).
- Divergence: If price moves up but MACD moves down, it may signal a reversal.
4. Bollinger Bands – Measuring Volatility
Bollinger Bands consist of:
- A middle SMA line (typically 20-day).
- An upper and lower band that expand and contract based on market volatility.
How to use:
- Price near upper band → Overbought, potential sell signal.
- Price near lower band → Oversold, potential buy signal.
- Squeeze: When bands tighten, a big price move is coming.
5. On-Balance Volume (OBV) – Confirming Trends with Volume
OBV tracks trading volume to confirm price trends.
- If OBV is rising → Buying pressure is strong (bullish signal).
- If OBV is falling → Selling pressure is increasing (bearish signal).
OBV helps confirm whether a trend has strong support or is losing momentum.
Using Multiple Indicators Together
No single indicator is enough. Traders combine trend, momentum, and volume indicators for better accuracy.
Example Trading Strategy:
- Use Moving Averages to find the trend.
- Check RSI for overbought/oversold signals.
- Use MACD to confirm momentum shifts.
- Watch Bollinger Bands for breakout opportunities.
By combining these indicators, traders increase their chances of making successful trades.
Final Thoughts
Understanding crypto charts is essential for anyone looking to navigate the cryptocurrency market effectively. These charts provide visual representations of price movements, helping traders make informed decisions. By learning to interpret different types of charts and their components, you can gain insights into market trends and potential future movements.
Investors Collective offers a wealth of resources and a supportive community for individuals seeking to enhance their cryptocurrency trading skills. Whether you’re a beginner or an experienced trader, their educational materials and expert insights can help you navigate the complexities of crypto trading with confidence.