
Master the Basics of Crypto Trading by Understanding the Order Book, Bid-Ask Spread, Depth Chart, and Liquidity
If you’ve ever opened a crypto exchange and seen a fast-moving wall of numbers—green here, red there—and thought, “What on earth is this?” you’re not alone.
That intimidating wall of numbers? It’s called the order book. Don’t worry it’s not some cryptic code reserved for Wall Street veterans. It’s simply a live display of buyers and sellers making their moves in real time. Once you learn how to read crypto charts for beginners, especially the order book, you’ll realize it’s one of the most powerful tools in your trading toolkit.
Think of the order book as the scoreboard of the crypto market. It shows who wants to buy, who wants to sell, and at what price points. While it won’t predict the future with certainty, it gives you a snapshot of current market activity and sometimes a glimpse of what might happen next.
Too many beginners skip the order book because it looks “too technical.” That’s a costly mistake. If you’re trading crypto without reading this chart, you’re essentially flying blind. You might stumble into a few lucky wins, but you’ll miss the smart, strategic trades that seasoned investors make daily.
Learning to read crypto charts for beginners starts with demystifying tools like the order book. Mastering it can give you an edge and it’s not as complex as it seems once you know what to look for.
This guide breaks it all down. No jargon. No complicated math. Just clear, simple advice on how to read crypto order books and actually use them to your advantage—whether you’re a curious beginner or someone who’s been guessing a bit too long.
Let’s get into it.
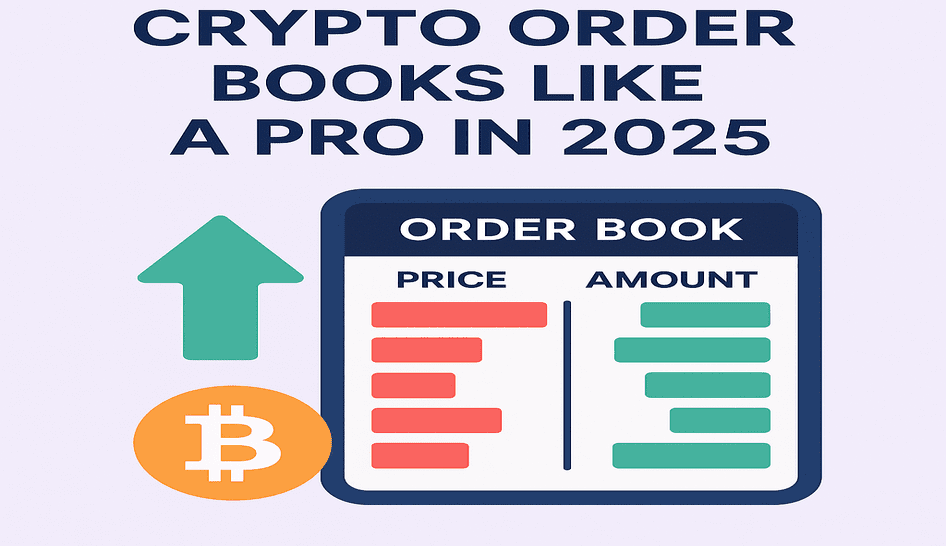
What Is a Crypto Order Book?
Let’s keep it simple.
A crypto order book is a live list of all the current buy and sell orders for a specific cryptocurrency on an exchange. That’s it. Nothing fancy. Just a running list of who wants to buy, who wants to sell, and at what price.
Think of it like an open-air market. One person shouts, “I’ll buy Bitcoin for $60,000!” Another says, “I’ll sell mine for $60,500!” The order book is just writing all that down—line by line, in real time.
There are two sides:
- Buy Orders (also called “bids”) — people who want to buy
- Sell Orders (also called “asks”) — people who want to sell
These orders stack up in the book until they match. When someone agrees on a price, boom—a trade happens.
Here’s a simplified look at what that might look like:
Sample Order Book Table
| Price (USD) | Amount (BTC) | Type |
| 60,700 | 1.2 | Ask |
| 60,650 | 0.8 | Ask |
| 60,600 | 1.5 | Ask |
| 60,500 | 0.5 | Last Trade |
| 60,400 | 0.9 | Bid |
| 60,350 | 1.1 | Bid |
| 60,300 | 2.0 | Bid |
In this table:
- The asks are stacked above the last trade. These are people selling at higher prices.
- The bids are below. These are people willing to buy at lower prices.
- The last trade price is where the most recent match happened.
The closer a bid is to the current price, the more likely it’ll get filled next. Same with asks.
This live updating list helps traders see what’s happening behind the scenes. It’s like looking under the hood before you decide to hit the gas.
2. Why the Order Book Matters in Crypto Trading
So, you now know what a crypto order book is—a bunch of buyers and sellers lined up, waiting to make a deal. But why should you care?
Because the order book shows you the real-time mood of the market.
Most people just look at the current price. Big mistake. That’s like judging a poker game by one card. The order book shows you the whole table: who’s confident, who’s bluffing, who’s about to make a move.
Here’s why it matters:
1. It helps you time your trades
If you see a lot more people trying to buy than sell, that tells you demand is high. That can mean prices might go up. Flip it, and it could mean a drop is coming.
2. It shows supply and demand clearly
The number of buy and sell orders at each price level gives you a sense of how strong the market is. Lots of big sell orders stacked up? That might be resistance. A thick row of buy orders? That’s support.
3. It helps avoid rookie mistakes
Ever placed an order and watched the price shoot the other way? You probably missed something in the order book. Like a giant sell wall about to crash the price.
4. It gives you a better feel for volatility
Thin order books = wild price swings. Thick books = more stable prices. If you’re trading in a quiet market, you might get stuck in a bad spot.
In short: reading the order book isn’t just for pros. It’s a way to stop guessing and start seeing. You don’t need to be a chart wizard. You just need to understand what the book is telling you.
Next up, we’ll break down the most important building blocks: bids, asks, and the bid-ask spread.
The Basics: Bids, Asks, and the Bid-Ask Spread
Now we’re getting into the meat of the order book. To make sense of what you’re looking at, you’ve got to understand bids, asks, and the space between them: the bid-ask spread.
Don’t worry, this is simple stuff once you see how it works.
What Are Bids and Asks?
Let’s go back to the idea of a marketplace. One side is buyers shouting out how much they’re willing to pay. The other side is sellers saying how much they want.
📌 Bids = Buyers
These are the people who want to buy crypto. They place orders at a specific price, hoping a seller will meet them there. The highest bid is the best offer from a buyer at that moment.
📌 Asks = Sellers
These are the folks trying to sell. They also name their price. The lowest ask is the cheapest offer from a seller on the market right now.
If a buyer and seller agree on a price—bam! A trade is made.
So, What’s the Bid-Ask Spread?
This is the gap between the highest bid and the lowest ask.
It looks small, but it says a lot about the market.
Example:
| Best Bid (Buy) | Best Ask (Sell) | Spread |
| $30,000 | $30,050 | $50 |
In this case, no one’s willing to sell below $30,050, and no one’s buying above $30,000. So there’s a $50 “gap” where no trading happens.
That’s the bid-ask spread.
Why the Bid-Ask Spread Matters
- Tight spread = More trading, more liquidity, less risk
- Wide spread = Thin market, harder to buy/sell fast, more chance of price slippage
Let’s say you’re buying Bitcoin. If the spread is tight (like $1), you can get in quickly without overpaying. But if the spread is wide (like $100+), you may either wait longer or settle for a worse price.
Smaller coins and low-volume trading pairs often have wider spreads. Big coins like Bitcoin or Ethereum usually have tighter spreads because they’re traded more.
Pro Tip:
Watch how fast bids and asks are updating. If they’re moving quickly and the spread stays tight, you’re in a liquid, active market. If they’re stale and far apart, proceed with caution.
Understanding the Depth Chart (And How to Read It)
Looking at rows of numbers can make your head spin. That’s where the depth chart comes in. It’s the visual version of the order book, and it tells the same story—just with curves instead of columns.
Think of it like a market mood ring.
What Is a Depth Chart?
A depth chart shows the supply and demand of a cryptocurrency in real time. It plots buy and sell orders as lines on a graph.
You’ll usually see two sides:
- Green line (left) = Buy orders (bids)
- Red line (right) = Sell orders (asks)
At the center, where the two lines meet? That’s the current market price—the last trade made.
What It Looks Like

- The steepness of the lines shows how many orders are stacked at different prices.
- A steep wall = lots of orders at that price.
- A flat area = fewer orders.
How to Read a Depth Chart
1. Buy Wall (Green Wall)
A sharp rise on the left side means there are a lot of buy orders at a certain price. This can act like a support level. It’s where buyers are saying, “We won’t let the price fall past here.”
2. Sell Wall (Red Wall)
A steep red wall on the right? That’s a bunch of sellers looking to cash out. It acts as resistance. It says, “You’ll have to pay more to break past us.”
3. Flat Zones
No big spikes? That usually means lighter trading and more volatility. Price can swing quickly because there’s not much holding it in place.
Why the Depth Chart Helps
- It shows strength: Big walls mean strong buying or selling interest.
- It shows danger zones: A sudden wall can block price movement—or send it the other way.
- It helps with timing: You can spot areas where the price might stall or bounce.
Quick Example
Let’s say you’re looking at a Bitcoin depth chart:
- Big green wall at $59,500 = lots of buyers want in.
- Big red wall at $60,500 = lots of sellers want out.
- Price is at $60,000.
That tells you the market might bounce between those two prices unless something changes.
Market Liquidity and What It Tells You
You’ve heard the term liquidity thrown around, right? Sounds like something to do with water or drinks. In crypto, it’s simpler than it sounds—and super important.
At its core, market liquidity just means how easy it is to buy or sell something without affecting the price too much.
What Is Market Liquidity in Crypto?
If a coin has high liquidity, that means:
- Lots of people are buying and selling
- Plenty of orders in the order book
- You can trade big amounts without moving the price much
If it has low liquidity, that means:
- Fewer buyers and sellers
- The order book looks empty or thin
- Even a small trade can make the price jump (or crash)
Why Liquidity Matters
Let’s say you’re trying to sell 1 Bitcoin.
- On a liquid market (like BTC/USDT on Binance), you can sell it in seconds without moving the price much.
- On an illiquid market (like a random altcoin with barely any volume), you might have to accept a much lower price—or sit there waiting forever.
How to Spot Liquidity in the Order Book
Here’s what to look for:
| Sign of High Liquidity | Sign of Low Liquidity |
| Tight bid-ask spread | Wide bid-ask spread |
| Thick rows of buy/sell orders | Thin order book with big gaps |
| Depth chart shows smooth curves | Depth chart has steep or sharp drops |
| Quick trade matching | Delays or huge slippage |
What’s Slippage?
Slippage is what happens when you place a trade—and get a worse price than expected.
Example:
- You try to buy at $1.00
- But not enough people are selling at $1.00
- So your trade fills at $1.05 instead
That $0.05 difference? That’s slippage. And low liquidity makes it worse.
Pro Tip:
If you’re trading small-cap coins or newer tokens, always check liquidity first. A price might look cheap—but if you can’t exit the trade later without taking a hit, that “deal” might cost you.
Real Examples: What Order Books Can Reveal
Crypto prices can move fast—but the order book usually drops hints before that happens. If you know how to read it, you can spot shifts, traps, and trends before everyone else.
Let’s look at some common scenarios traders face and how the order book gives away the game.
Example 1: The Disappearing Wall (aka “Spoofing”)
You’re watching Bitcoin trade at $30,000.
Suddenly, a huge sell wall pops up at $30,100. It looks like a flood of sellers are waiting. Price hesitates. Traders panic. Some start selling early.
Then—boom—the wall vanishes. Price rockets past $30,100.
What just happened?
That was probably spoofing—a fake order placed to scare the market. It tricks people into thinking a big move is coming, then disappears before filling. Watch for big orders that appear and disappear fast.
Example 2: The Buy Wall That Holds the Line
ETH is dropping fast. Everyone’s worried it might crash further.
Then you see a massive buy wall at $2,400. And it holds. Sellers hit it again and again, but the wall doesn’t budge.
Price bounces off that level and starts climbing again.
What’s that mean?
Someone’s buying—a lot. A thick buy wall like this can act like a floor. Big buyers (often called “whales”) use these walls to scoop up coins or support a price level.
Example 3: Thin Book, Big Risk
You’re eyeing a small altcoin. The chart looks great. Volume looks “okay.”
But you check the order book—and it’s thin. Just a few buy and sell orders, spaced far apart. No real size behind the numbers.
You place a market buy for $1,000—and suddenly the price jumps 8%. Congrats, you just moved the market.
Why?
Low liquidity and a shallow order book means your order had to “climb up” the asks to get filled. This creates slippage and opens you up to big losses on the exit.
Final Example: Stacking Orders
A smart trader sees resistance at $1.20 on a coin.
She starts placing small sell orders every few cents below it—$1.17, $1.18, $1.19. Nothing huge. Just enough to slow the price down.
The effect? The chart looks like it’s struggling to break through. Other traders hesitate. Price stalls. She sells at the top.
This tactic? It’s called order stacking, and it works because other traders react to what they see in the book.
The order book isn’t just a bunch of numbers. It’s behavior. It’s strategy. And sometimes, it’s deception. But if you know what to look for, it can tip you off before the market moves.
Tips to Use the Order Book in Your Trades
Now that you know how to read crypto order books, let’s talk about how to use that info to trade smarter—not harder.
You don’t need to stare at the order book all day. You just need to know when to check it, what to look for, and how it fits into your overall decision-making.
Here’s how to make it work for you:
1. Use Limit Orders, Not Market Orders
Market orders buy or sell at the best available price right now. That sounds fast—but it can also be expensive if the order book is thin.
Instead:
- Use limit orders to name your price and let the market come to you
- You avoid slippage
- You can place your order where there’s real support or resistance
2. Watch for Large Walls
- Big buy walls can act like support (price may bounce)
- Big sell walls can act like resistance (price may stall)
But remember: sometimes walls are fake (spoofing). If a wall appears and vanishes quickly, don’t trust it. Real support usually stays visible and gets hit multiple times.
3. Use the Order Book With Other Tools
The order book gives you context, but it’s not a crystal ball.
Pair it with:
- Volume trends
- Price levels from charts
- News or major events
Example: If you see a huge buy wall and volume is picking up, that wall is probably real—and price.
4. Look for Imbalance
If the bid side is stacked and the ask side is thin, demand is higher than supply. That often signals a price move up.
If it’s the other way around—more sell pressure than buy support—it could mean a drop is coming.
5. Check the Depth Chart Before Entering a Trade
Scan the chart for:
- Sharp cliffs or drops (thin zones = risky)
- Flat, steady areas (more stable trading)
- Giant walls (could slow or reverse price)
Ask yourself: If I place a $500 (or $5,000) order right now, will it move the price? If yes, you’re in a low-liquidity situation. Adjust your plan.
6. Use Order Flow to Gauge Momentum
Is the best bid price rising over time? Are asks getting sold into repeatedly?
That’s momentum. The order book helps you catch it early—before the chart even confirms it.
7. Don’t Overthink Every Tick
The order book changes constantly. Don’t get caught in the noise.
Focus on:
- Major walls
- Volume shifts
- Imbalances that stick around for more than a few seconds
If you see consistent pressure in one direction, that’s more important than short-term flickers.
Conclusion
Understanding how to read crypto order books isn’t just a skill—it’s a trading superpower. By mastering this, you shift from being a passive observer to an informed, strategic trader. The order book reveals real-time market dynamics, helping you make confident decisions based on live data. Whether you’re identifying buy walls, analyzing the bid-ask spread, or assessing market liquidity, this insight is crucial for both long-term vs short-term trading approaches. Long-term investors can spot accumulation trends, while short-term traders can capitalize on quick shifts in momentum. Either way, the order book becomes your key to navigating crypto markets with precision.
At Investors Collective, we’re committed to empowering traders at all levels with the knowledge and tools they need to succeed in the ever-evolving crypto landscape. Our community thrives on collaboration, education, and shared insights, ensuring that whether you’re just starting out or looking to refine your strategies, you have the support and resources to navigate the crypto markets effectively.
So, next time you open your trading platform, take a moment to glance at the order book. It’s more than just numbers—it’s a reflection of market sentiment, a guide to potential opportunities, and a testament to the dynamic world of crypto trading.